Water Temperature
Project main page || Data || Relationships || Further resources
Introduction:
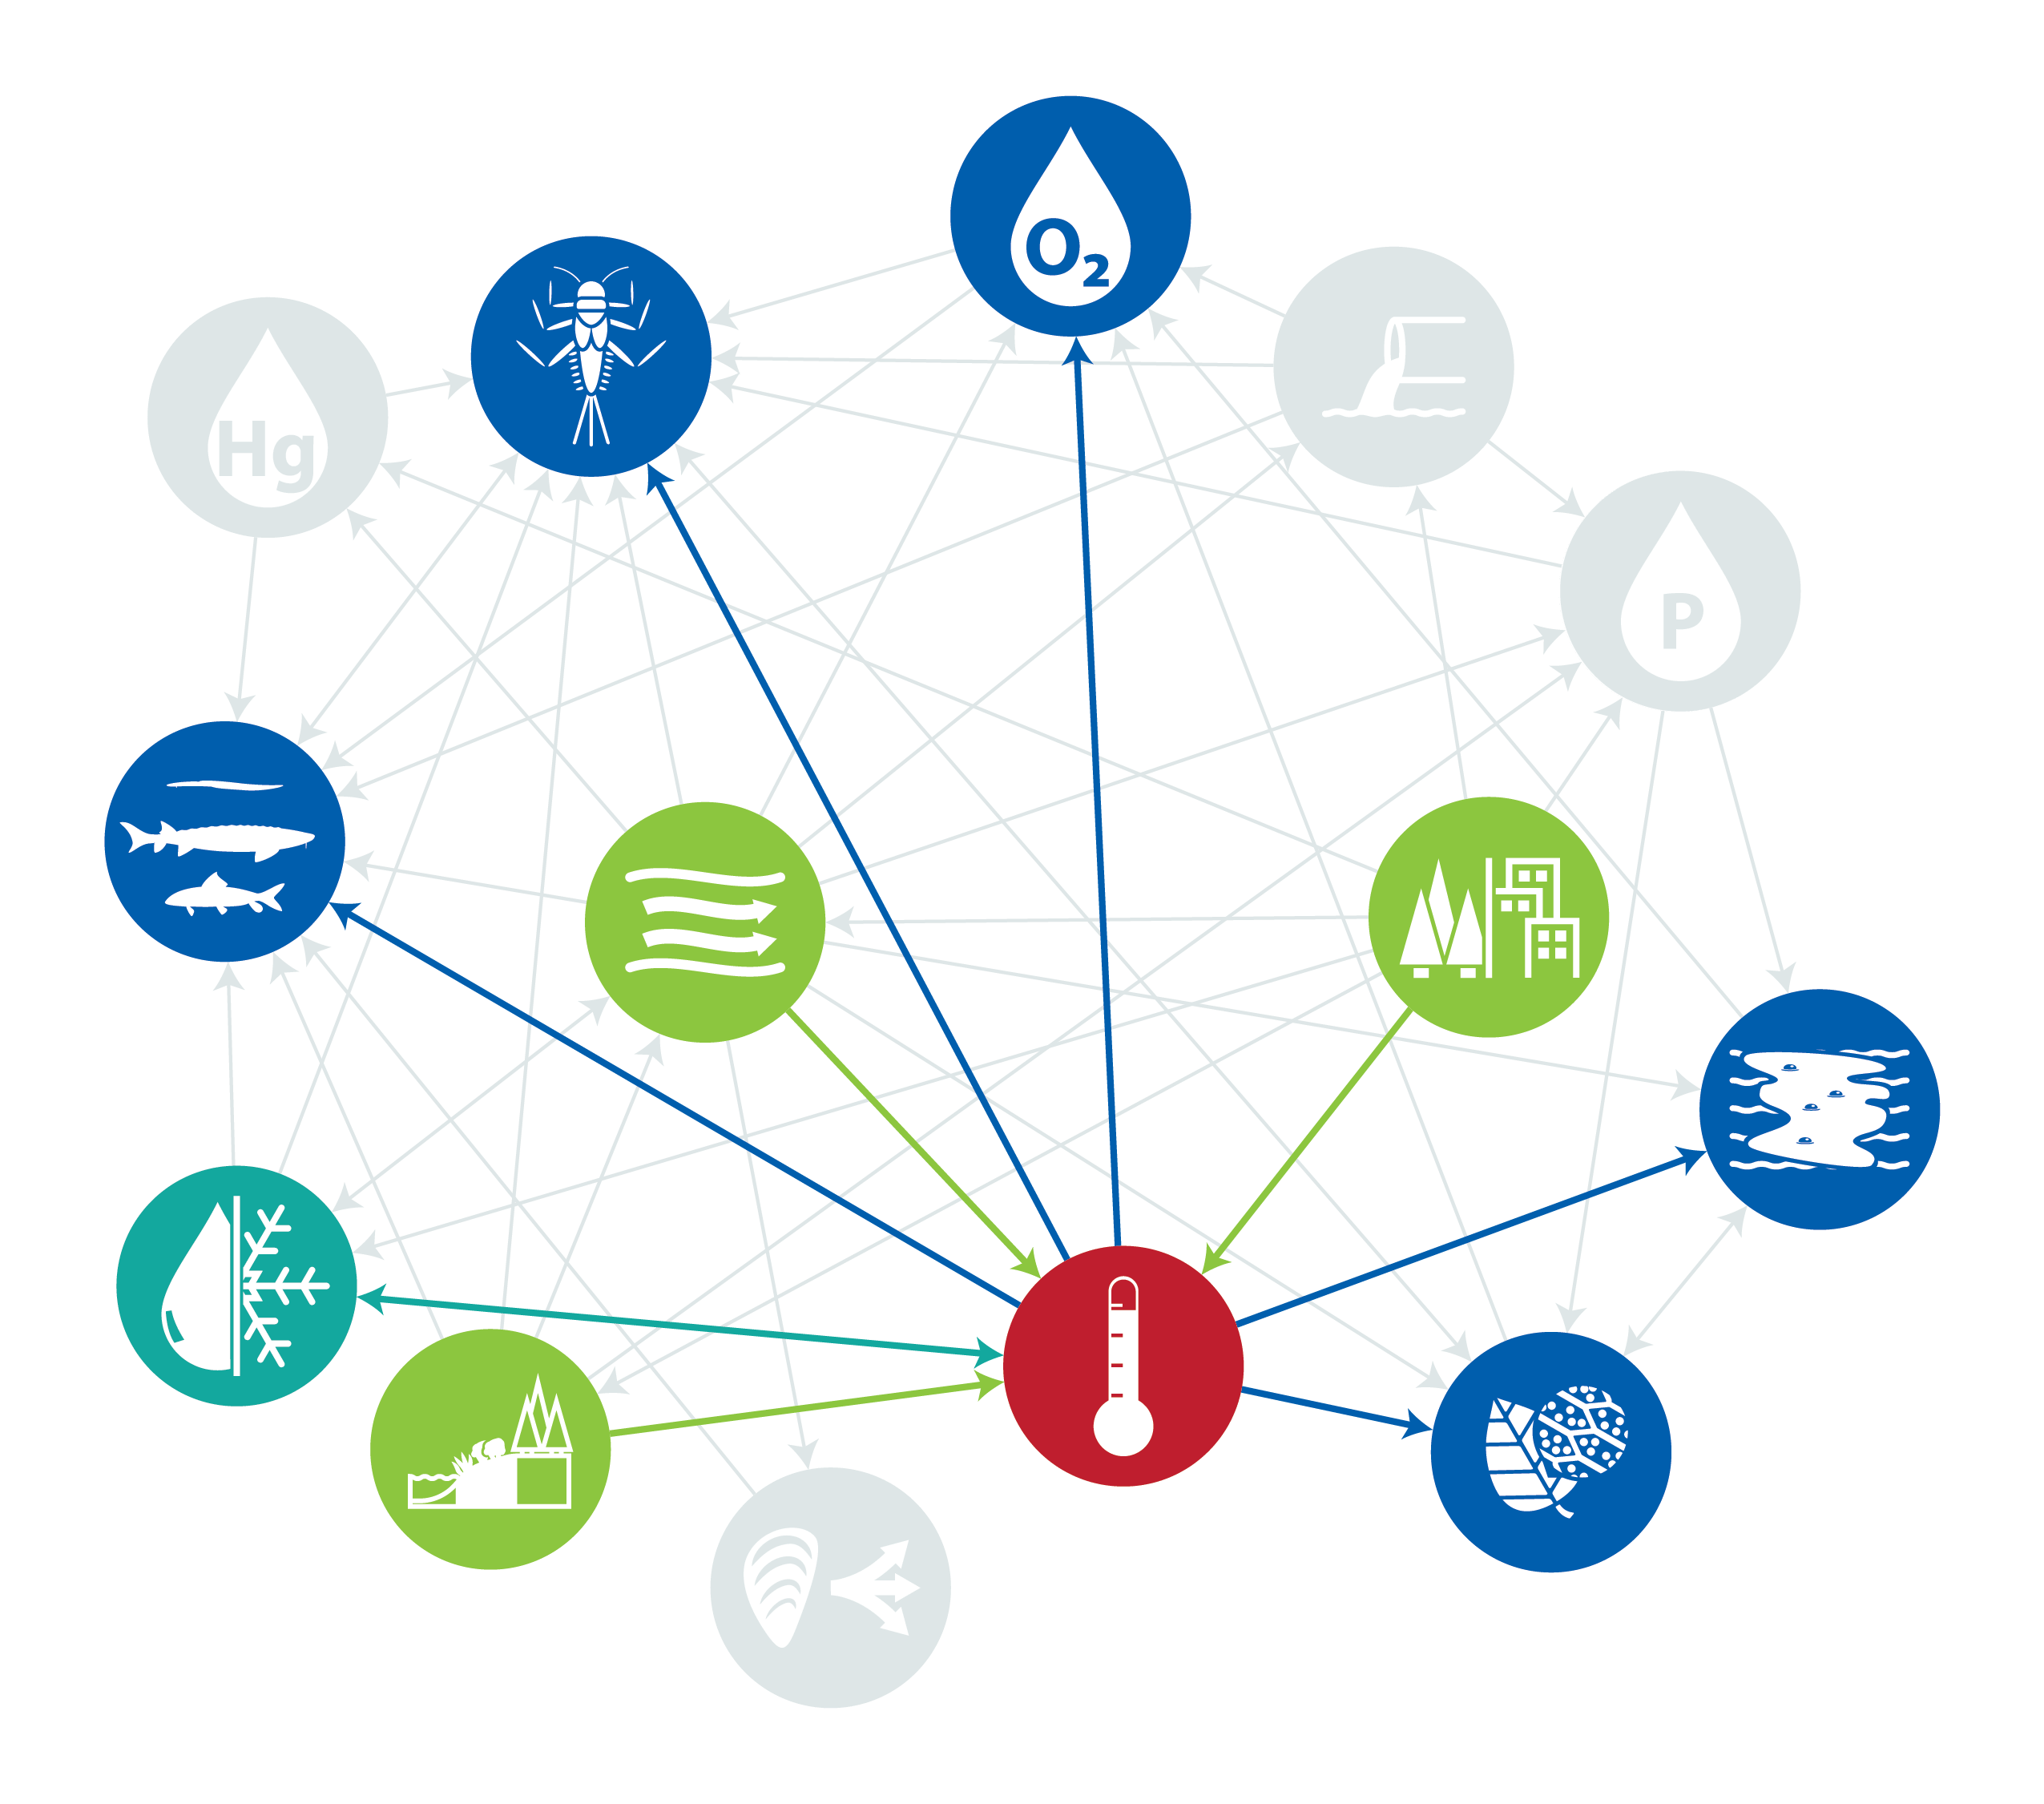
Water temperature is strongly correlated with a number of other important indicators of ecological status, and can often help to explain, give context to, or even predict changes in habitat quality.
Water temperature is affected by many natural, abiotic factors such as flow (particularly water quantity), depth, air temperature and sunlight. In the Ottawa River watershed, different areas of the watershed can have very different temperature trends. For example, a lake, being a larger body of water, takes longer to warm up and cool down when the air temperature changes. This results in a more temperature-stable environment than a small stream, which will change rapidly. Furthermore, deeper water will often be more stable than the water at the surface, because it is not directly affected by sunlight or air temperature. Different species of fish, invertebrates, mollusks and plants have different temperature tolerances and requirements and those with a narrow range of temperature tolerance might be restricted to more stable environments.
Water temperature is of special interest because of its significant impact on several other important indicators of watershed health. As mentioned above, temperature can have a direct influence on fish and invertebrate populations, but it can also have indirect influences through its strong correlation with dissolved oxygen. As temperature increases, the capacity of the water to hold oxygen decreases, meaning cold water will have more oxygen than warm water. A fish may be able to tolerate warm temperatures, but if it has high oxygen demands, it may be restricted to cooler waters where more dissolved oxygen is available. Water temperature (along with air temperature and other weather-related factors) also significantly influences when ice appears and disappears from different areas of the river, known as ice on/ice off conditions.
Temperature can also influence threats to ecological health such as algal blooms; warmer temperatures, among other factors, promote algal growth. With global temperatures on the rise, water temperature (particularly annual maximum temperatures) will be a crucially important indicator of watershed health moving forward.
What do we know about temperature data in the watershed?
A major challenge for understanding watershed health is that data is limited and sporadic. As shown below, temperature data is only available at 5 locations along the main stem of the Ottawa River. Although data is available as far back as the 1960s for some locations, there are many multi-year gaps in this data, and most locations only reported temperature data once a month or less. Trying to understand trends or calculating “maximum temperature” values with data that is infrequent can lead to unreliable results. This is especially true for years when no temperatures were reported in either July or August (or both), the time of year when maximum values are typically recorded. For years when data was not collected during those two months, maximum temperature data points were excluded from the Bottom Right figure to not misrepresent the data.
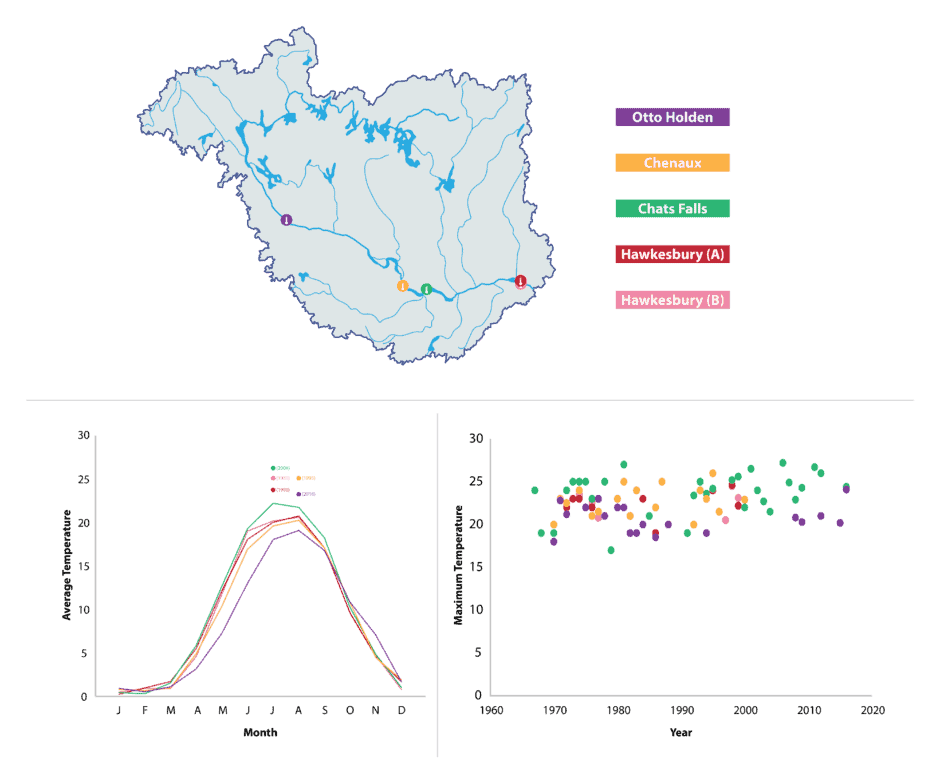
Each location has both a monthly average temperature (lines) and historical maximum temperature (points) for the year and month they occurred. Average annual and historical maximum temperatures occurred in either July or August at all locations. Analysis was limited by available data, so not all months/locations were calculated using the same number of values.
Annual maximum temperature from years when at least one sample was measured during both July and August, the months when temperatures tend to peak.
Further data:
Want to dive further into the data on Water Temperature in the watershed? Take a look at our dashboard for this indicator.
Relationships to other indicators:
Water Temperature
With global temperatures on the rise, water temperature (particularly annual maximum temperatures) will be a crucially important indicator of watershed health moving forward. Water temperature is strongly correlated with a number of other important indicators of ecological status, and can often help to explain, give context to, or even predict changes in habitat quality.
Algal Blooms
Algae are a group of single-celled and multicellular plant-like organisms. Algal growth contributes and supports the ecosystem in much the same way that plants do, through the production of oxygen and as a potential food source for smaller animals. However, when environmental conditions shift from their normal ranges, this can promote algal blooms, a rapid increase in population size of algae.
Dissolved Oxygen
Dissolved oxygen (DO) is the concentration of free oxygen in the water column and comes from aquatic plants and algae through photosynthesis, and can also be transferred from the air at the surface of the water. DO is essential for all aquatic life and for the decomposition of organic waste. The amount of available oxygen in the water column is also affected by several abiotic factors including temperature, salinity, pressure and depth, wind, flow, and wave action.
Chlorophyll-a
Chlorophyll-a is used in oxygenic photosynthesis and is the predominant form of chlorophyll in green plants and algae. Measuring the presence of chlorophyll-a in an aquatic environment allows for a better understanding of the density and prevalence of algae which can have an impact on the concentration of dissolved oxygen or likeliness of algal blooms.
Total Phosphorus
Phosphorus is a fundamental building block of life. It has key structural roles in genetic material (eg. DNA) and cellular membranes, and is an active component of cellular energy production, storage, and transfer, meaning many necessary biochemical processes that all living organisms rely on (such as respiration, and nutrient absorption) can only happen if phosphorus is available.
Riparian Connectivity
Natural, vegetated riparian areas, the unique, transitional space between aquatic and terrestrial ecosystems, provide numerous benefits including nearshore habitat, filtering runoff, moderating local temperatures, and stabilizing shorelines. Measuring riparian connectivity can provide important information on the health of a watershed and a better understanding of the resilience to threats these areas have compared to shorelines that have been developed.
Combined Sewer Overflows
Everytime there is a Combined Sewer Overflow, sewage, along with stormwater is released into a waterbody introducing pollutants, pathogens and excess organic waste. Untreated or inadequately treated sewage poses health risks for people who use the water for recreational activities, such as swimming, paddling, etc. It also impacts aquatic ecosystems as the presence of organic matter, and its decomposition, decreases the amount of dissolved oxygen available.
Flow
How much water or volume of water present at a given time and how quickly it moves along the length of the river determines flow. Flow can provide context to a number of other indicators and as an important measure to factor when examining water chemistry or understanding impact of pollutants (for example, the same concentration of pollution will impact a river with low flow differently than one with high flow). Comparing flow within the same reach can help identify different trends and, when affected by barriers, can impact aquatic biota.
Change in Land Use
Land use is a classification for all the various ways an area of land be used and includes agriculture, urban, roads, natural and harvested forests, wetlands and protected areas. Changes in land use have implications for both the quantity and quality of water introduced to the river through runoff and can help analyse changes in other indicators in proximity to where land use changes have occurred.
Benthic Invertebrates
Benthic invertebrates are the organisms found in soils, rocks and organic materials that make up stream, river, and lake beds. Pollution tolerance varies greatly between different species, so the relative abundances of pollution-sensitive and pollution-tolerant benthic invertebrate species is a good indicator of water quality and ecosystem health.
Invasive Species
Invasive species are non-native species that have been introduced to a habitat and are able to outcompete native species. Invasive species disrupt the established ecosystem which can result in a decrease in habitat quality and health.
Fish Richness
Fish richness is a measure of how many different species of fish are present in an ecosystem or habitat. Generally speaking, higher species richness is better, but some confounding factors include habitat type and the presence of invasive species (which can increase richness while threatening ecosystem health).
Water Mercury
Mercury is highly toxic, but naturally occurring concentrations of it are bound by plants and sediment and removed from the water column. However, human activity introduces excess mercury, resulting in free mercury in the water column. Water mercury is therefore a useful indication of human impact on the watershed.
Ice On/Off
Ice on is the date when a body of water is fully covered by ice, and ice off is the date when the ice disappears from the water surface. These measurements provide information about several environmental conditions, such as air temperature, water temperature, and flow.
Further resources:
Nothing here yet!